介绍
本文更新于 2018.10.11
本文介绍VTune工具的安装与基本使用.
简介
参考: https://software.intel.com/en-us/vtune-amplifier-help-introduction
Intel® VTune™ Amplifier是一款功能强大的性能分析工具, 可帮助开发人员分析算法选择, 以及如何从硬件资源获益. vtune可以分析定位:
- 程序或系统中最耗时(hot)的函数
- 没有有效利用处理器时间的代码片断
- 影响单线程或多线程性能的关键代码
- 影响程序性能的同步对象
- 在I/O操作上耗时较长的原因
- 不同同步方法,不同线程数量,或不同算法造成的性能影响
- 线程活动
- 硬件相关的问题, 如数据共享,cache miss,分支预测失败等
vtune可以安装在Windows, macOS和Linux平台上, 可分析本地或远程目标. 默认安装目录为:
- Windows OS: [Program Files]IntelSWToolsVTune Amplifier <version>
- Linux OS: /opt/intel/vtune_amplifier_<version>
- macOS: /Applications/Intel VTune Amplifier <version>.app
注解
在macOS上不支持分析本地目标
下表罗列了vtune对于不同分析目标的主要支持:
| Analysis | Windows Target | Linux Target | Android Target | FreeBSD Target |
|---|---|---|---|---|
| 热点分析 | √ | √ | √ | |
| 线程分析 | √ | √ | ||
| 远程目标 | √ | √ | √ | √ |
| 运行在容器的目标 | √ | |||
| IDE | √ | √ | ||
| HPC性能分析 | √ | √ | ||
| 微架构分析 | √ | √ | √ | √ |
| 内存访问分析 | √ | √ | ||
| 内存消耗分析 | ||||
| I/O(包括DPDK和SPDK程序)分析 | (1) | √ | ||
| 系统全局分析 | √ | √ | √ | |
| 自定义分析 | √ | √ | √ | √ |
| GPU分析 | √ | √(2) | √ | |
| 平台评测 | √(1) | √(1) | ||
| OpenCL内核分析 | √ | √(2) | ||
| Intel Media SDK程序分析 | √(2) | |||
| Java代码分析 | √ | √ | √ | |
| .NET代码分析 | √ | |||
| Python代码分析 | √ | √ | ||
| Go程序分析 | √(3) | √(3) | ||
| OpenMP分析 | √ | √ | ||
| MPI分析 | √ | √ | ||
| KVM客户系统分析 | √ | |||
| Ftrace事件分析 | √ | √ | ||
| Atrace事件分析 | √ | |||
| 耗能分析(仅虚拟化) | √ | √ | √ |
注:
- (1) 仅预览
- (2) 仅支持Intel HD和Intel Iris显卡
- (3) 仅EBS分析
VTune Amplifier provides features that facilitate the analysis and interpretation of the results:
- Top-down tree analysis: Use to understand which execution flow in your application is more performance-critical.
- Timeline analysis: Analyze thread activity and the transitions between threads.
- ITT API analysis: Use the ITT API to mark significant transition points in your code and analyze performance per frame, task, and so on.
- Architecture diagram: Analyze GPU OpenCL™ applications by exploring the GPU hardware metrics per GPU architecture blocks.
- Source analysis: View source with performance data attributed per source line to explore possible causes of an issue.
- Comparison analysis: Compare performance analysis results for several application runs to localize the performance changes you got after optimization.
- Start data collection paused mode: Click the Start Paused button on the command bar to start the application without collecting performance data and click the Resume button to enable the collection at the right moment.
- Grouping: Group your data by different granularity in the grid view to analyze the problem from different angles.
- Viewpoints: Choose among preset configurations of windows and panes available for the analysis result. This helps focus on particular performance problems.
- Hot keys to start and stop the analysis: Use a batch file to create hot keys to start and stop a particular analysis.
警告
vtune依赖于汇编级的指令, 因此它在分析编译为非intel架构指令的程序时可能会出现错误
安装
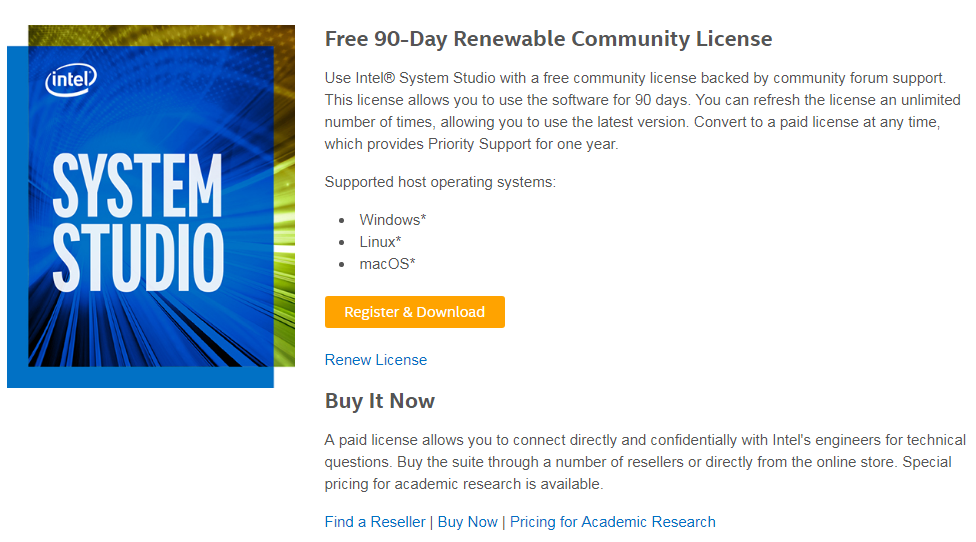
2018.10.10更新: 目前intel提供Intel System Studio的90天免费版本, 使用社区license, 90天后可刷新license继续使用, 见 https://software.intel.com/en-us/system-studio/choose-download
其中不仅有vtune, 还有intel编译器, intel Inspector, intel Threading Building Blocks等多个工具.
参考: https://software.intel.com/en-us/vtune-amplifier-help-installation
以安装vtune_amplifier_xe_2016_update2为例, 某些操作步骤需要root权限.
将vtune_amplifier_xe_2016_update2.tar.gz解压
进入解压目录, 以root权限运行 install.sh:
$./install.sh
--------------------------------------------------------------------------------
Initializing, please wait...
--------------------------------------------------------------------------------
Step 1 of 7 | Welcome
--------------------------------------------------------------------------------
Welcome to the Intel(R) VTune(TM) Amplifier XE 2016 Update 2 setup program.

Intel(R) VTune(TM) Amplifier XE is an advanced performance and thread profiler
targeted for optimizing serial and parallel performance of C, C++, Fortran,
Assembly and Java* applications on Linux* OS.
--------------------------------------------------------------------------------
You will complete the steps below during this installation:
Step 1 : Welcome
Step 2 : License agreement
Step 3 : Activation
Step 4 : Intel® Software Improvement Program
Step 5 : Options
Step 6 : Installation
Step 7 : Complete

Note: The drivers for Hardware Event-based Sampling (EBS) data
collection require a genuine Intel processor and a non-virtual OS.

--------------------------------------------------------------------------------
Press "Enter" key to continue or "q" to quit:
按下回车键继续
接下来检测系统需求, 如果是在vmware等虚拟机上安装, 有些可选的依赖项会不满足, 可以选择[1]继续安装:
Missing optional prerequisites
-- The system is running in the virtual environment. Sampling drivers will not
be installed.
-- Cannot detect gtk library
--------------------------------------------------------------------------------
1. Skip missing optional prerequisites [default]
2. Show the detailed info about issue(s)
3. Re-check the prerequisites

h. Help
b. Back to the previous menu
q. Quit
--------------------------------------------------------------------------------
Please type a selection or press "Enter" to accept default choice [1]:
接下来要同意license条款, 输入accept即可:
Do you agree to be bound by the terms and conditions of this license agreement?
Type 'accept' to continue or 'decline' to go back to the previous menu: accept
进行产品激活, 有3种yyaa, 这里我选择license文件激活方式, 选择[3]:
1. I want to activate my product using a serial number [default]
2. I want to evaluate this product or activate later
3. I want to activate by using a license file, or by using Intel(R) Software
License Manager

h. Help
b. Back to the previous menu
q. Quit
--------------------------------------------------------------------------------
Please type a selection or press "Enter" to accept default choice [1]: 3
选择离线激活, 接着要求输入license文件的完整路径:
1. Activate offline [default]
2. Use Intel(R) Software License Manager

h. Help
b. Back to the previous menu
q. Quit
--------------------------------------------------------------------------------
Please type a selection or press "Enter" to accept default choice [1]:
Please type the full path to your license file(s):
/home/zzq/pkg/permanent.lic
激活成功后按回车继续.
选择是否愿意参与intel软件改进计划
接下来开始安装, 选择[1]开始默认安装:
1. Start installation Now [default]
2. Customize installation

h. Help
b. Back to the previous menu
q. Quit
--------------------------------------------------------------------------------
Please type a selection or press "Enter" to accept default choice [1]:
至此安装步骤完成.
有些系统需要安装Sampling Driver, 否则进行某些分析时会出现警告. Sampling Driver 下载与安装参考:
- https://software.intel.com/en-us/articles/intel-vtune-amplifier-sampling-driver-downloads
- https://software.intel.com/en-us/vtune-amplifier-help-building-and-installing-the-sampling-drivers-for-linux-targets
在CentOS7.3, 内核版本上, 安装前:
$ cd <install_dir>/sepdk/src
$ ./insmod-sep -q
pax driver is loaded and owned by group "vtune" with file permissions "666".
socperf3 driver is not loaded.
sep5 driver is not loaded.
vtsspp driver is loaded and owned by group "vtune" with file permissions "666".
安装后:
$ cd <install_dir>/sepdk/src
$ ./insmod-sep -q
pax driver is loaded and owned by group "vtune" with file permissions "666".
socperf3 driver is loaded and owned by group "vtune" with file permissions "666".
sep5 driver is loaded and owned by group "vtune" with file permissions "666".
vtsspp driver is loaded and owned by group "vtune" with file permissions "666".
一般使用
启动
参考: https://software.intel.com/en-us/vtune-amplifier-help-launch
启动之前需要设定环境变量, 以Linux为例:
- csh/tcsh:
source /opt/intel/vtune_amplifier_xe_2016.2.0.444464/amplxe-vars.csh - bash:
source /opt/intel/vtune_amplifier_xe_2016.2.0.444464/amplxe-vars.sh
2018.10.10更新 system studio 2019中的vtune:
- csh/tcsh:
/opt/intel/system_studio_2019/vtune_amplifier_2019/amplxe-vars.csh - bash:
/opt/intel/system_studio_2019/vtune_amplifier_2019/amplxe-vars.sh
可以将source命令加入.bash_profile等文件以便用户登录shell时就生效, 免得每次都要运行命令.
然后可以通过命令行和GUI两种方式启动vtune:
- 命令行: 调用
amplxe-cl, 如amplxe-cl -collect hotspots -r res ./app - GUI: 调用
amplxe-gui
新建项目
参考: https://software.intel.com/en-us/vtune-amplifier-help-set-up-project
以GUI方式使用vtune时, 需要对要分析的程序建一个工程, vtune工程会存放分析类型和相关性能采集数据等.
建立工程后, 还需要设置3个主要选项:
WHERE 在何处执行分析
在运行了vtune的当前系统上进行分析, 称为local, 其他情况则称为remote. vtune支持的目标系统包括:
目标系统 说明 Local Host 在本地主机上进行性能收集(不支持macOS) Remote Linux(SSH) 在远程一般或嵌入式Linux系统上运行性能收集,使用SSH连接 Android Device(ADB) 在Android设备上运行性能收集,使用Android Debug Bridge(ADB)连接 Arbitrary Host 为本机无法访问的主机生成命令行, 详见生成命令行的示例:$mpirun -n 14 -gtool "amplxe-cl -collect memory-access:2-4,6-7,8" /temp/vtune/testWHAT 分析什么
vtune可以分析的目标(target)包括可执行文件, 进程, 或整个系统.
目标 说明 Launch Application 分析应用程序. 此类型不支持Android程序的hotspot分析 Attach to Process 分析已有进程 Profile System 分析整个系统 Launch Android Package 分析Android程序 HOW 分析类型
vtune提供了一套预置的分析类型, 可用于不同的性能优化目的:
Hotspots 组:
- Hotpots 用于分析耗时代码, 优化算法
- Memory Consumption 用于分析内存占用, 仅支持C/C++和Python代码和Linux
Parallelism 组:
- Threading 可视化并行多线程, 定位导致并发问题的原因, 分析串行性能瓶颈
- HPC Performance Characterization 分析计算密集型的OpenMP或MPI程序对CPU, 内存和FPU资源的占用
Microarchitecture 组:
- Microarchitecture Exploration (旧称General Exploration) 分析CPU pipeline stage(front-end, back-end等), 以及其他可能造成硬件瓶颈的硬件单元
- Memory Access 用于分析内存攸关程序的CPU cache和主内存使用情况, 包括NUMA相关问题
另外, vtune还提供了 Platform 组, 用于分析特定情形, 比如GPU, I/O, IRQ等:
- CPU/GPU Concurrency 分析代码在多个CPU和GPU核上的执行情况, 确定程序受限于CPU还是GPU
- GPU Compute/Media Hotspots 用于使用GPU来渲染,处理图像或进行计算的程序. 如果已使用CPU/GPU Concurrency确定程序是GPU受限的,则可使用此类型来进一步确定耗时的GPU计算任务, 分析每个GPU单元的性能
- GPU In-Kernel Profiling 用于GPU受限程序, 逐行代码分析GPU内核执行情况, 确定由于内存延迟或低效内核算法导致的性能问题
- System Overview 和驱动无关的基于事件采样的分析, 可监控Linux/Android目标系统的的一般行为, 通过IRQ(interrupt request)处理找出耗能和性能之间的关系
- Input and Output 分析IO子系统, CPU和处理器总线的使用
- GPU/FPGA Interaction(preview) 分析FPGA加速器的使用, 确定最耗时的FPGA计算任务
- GPU Rendering(preview) 评估运行在Xen虚拟化平台上的代码对CPU/GPU的使用情况
- Platform Profiler(preview) 系统性能分析. 数据收集在外部命令行运行, 结果以web 浏览器展示.
除此之外, 高级用户还可以通过vtune提供的数据收集器创建自定义分析, 也可以混合使用vtune预置收集器和其他自定义收集器.
搜索目录
设置可执行文件, 符号, 源代码等所在目录.
执行分析
以分析基本的CPU热点(Hotspots)为例.
vtune的hotspots分析提供两种基于采样的收集模型:
- User-mode Sampling 会带来较大的开销, 但不需要采样驱动. 从vtune 2019开始, 此模型取代了之前的Basic Hotspots analysis.
- Hardware event-based Sampling 提供最小收集开销, 但需要安装采样驱动或Perf. 从vtune 2019开始, 此模型取代了之前的Advanced Hotspots analysis.
建好工程后, 运行分析的步骤如下:
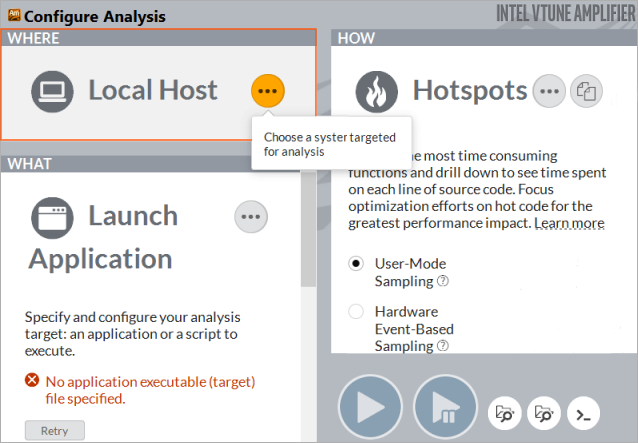
- 点击工具栏上的”Configure Analysis”按钮, 打开分析配置窗口
- 在”HOW”面板上, 点击”...”按钮, 选择”Hotspots”分析
- 配置选项, 比如选择User-Mode Sampling还是Hardware Event-Based Sampling, 还可以修改采样间隔时间
- 点击开始按钮, 运行分析
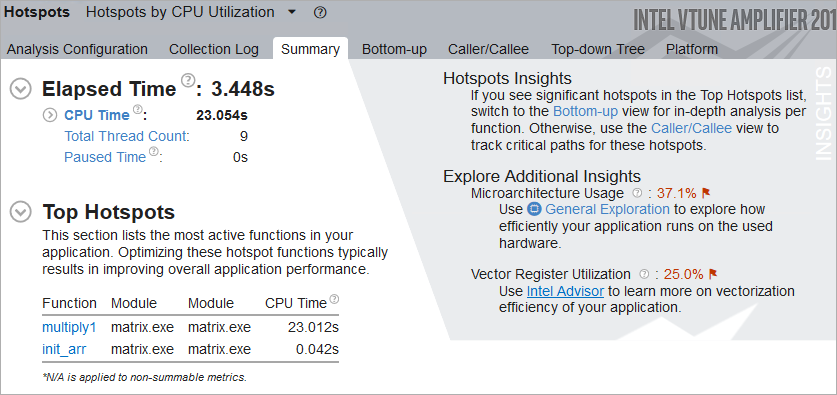
此时将会开始分析并收集数据, 直到程序运行完成或手动停止, 然后vtune将打开Hotspots by CPU Utilization窗口, 如下图所示:
查看性能数据
这里vtune提供了以下分析视图:
- Summary 显示总体统计
- Bottom-up 以bottom-up树形式显示热点函数, 每个函数会显示CPU时间和CPU使用率
- Top-down Tree 以调用树形式显示热点函数, 显示单个函数的性能数据, 以及此函数和其子函数总的性能数据
- Caller/Callee 显示选中函数的父函数和子函数
- Platform 显示CPU/GPU利用率, 帧率(frame rate), 内存带宽, 用户任务等详细信息
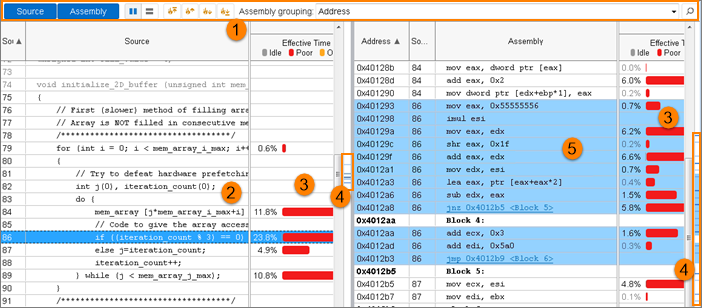
在Bottom-up等视图中, 双击函数名, 会打开对应的源码窗口, 并定位到对应的源码行, 如下图所示: