教程: 优化热点
本文更新于 2018.10.10
本文演示了如何找出并优化程序中运行最耗时的代码片断, 同时也给出了使用vtune的一般操作.
参考: https://software.intel.com/en-us/vtuneampxe_hotspots_lin_c
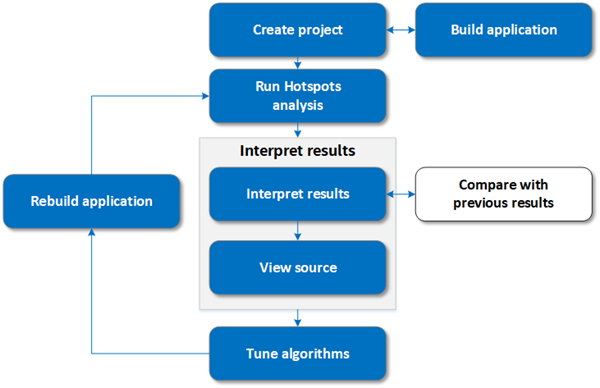
工作流:
编译示例程序
以vtune 2016为例, 示例程序tachyon的默认位置在 /opt/intel/samples_2016/en/vtune_amplifier_xe/C++/tachyon_vtune_amp_xe.tgz, 将其解压到某目录, 并进入tachyon目录运行make进行编译.
在某些系统上可能会提示:
!!!!!!!!!!!!!!!!!!!!!!!!!!!!!!!!!!!!!!!!!!!!!!!!!!!!!!!!!!!!!!!!!!!!!!!!!!!!!!!!
Warning: You  don't have library libXext.so in directories  /usr/X11R6/lib64 or /usr/lib64.
If you want to see rendered picture:
Please, install the X11 dev tools. Or if it is installed then make symlink
in /usr/X11R6/lib64/ or /usr/lib64/for libXext.so
!!!!!!!!!!!!!!!!!!!!!!!!!!!!!!!!!!!!!!!!!!!!!!!!!!!!!!!!!!!!!!!!!!!!!!!!!!!!!!!!
可以根据提示安装X11开发包, 否则接下来运行tachyon时无法看到图像. 编译完成后运行程序:
$./tachyon_find_hotspots dat/balls.dat
Scene contains 7386 bounded objects.

CPU Time: 13.159 seconds.
这是未优化时的执行时间, 我们将以此为性能优化对比的基线.
创建vtune工程并运行分析
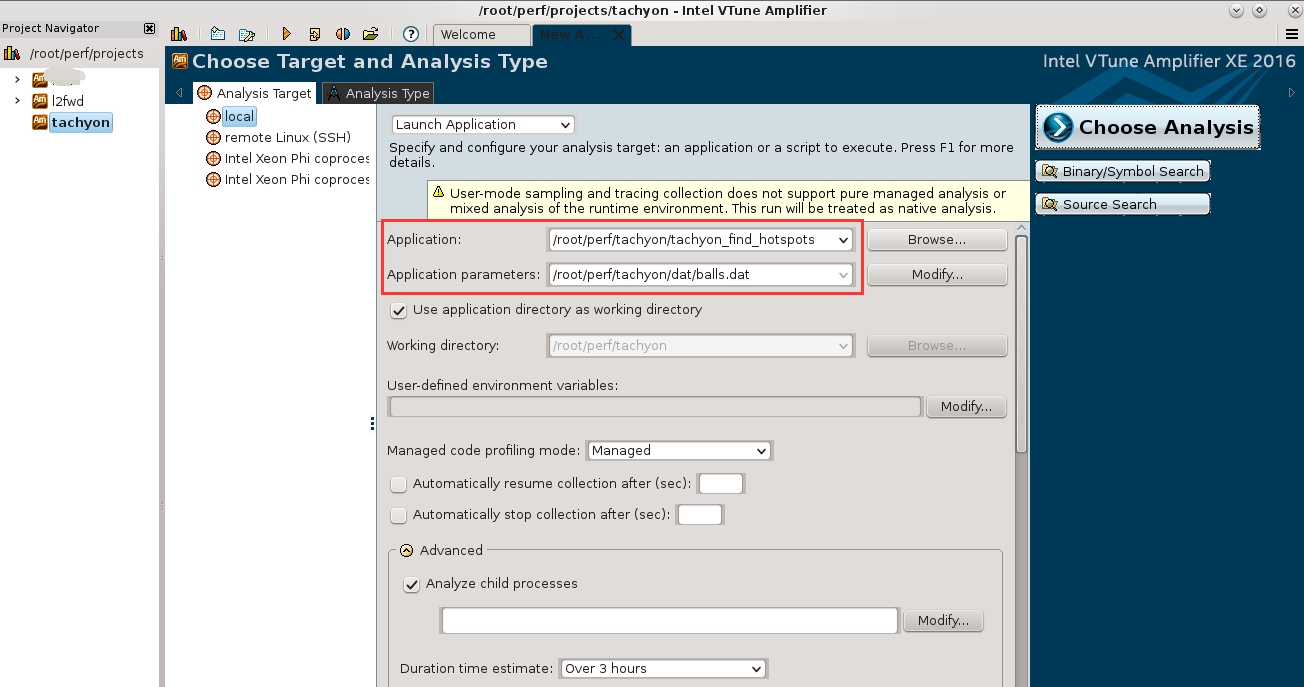
新建工程, 目标系统为本地, 设置可执行程序位置和参数, 如下图所示, 并点击界面右侧的 “Binary/Symbol Search”和”Source Search”, 在弹出的对话框中指定可执行程序, 符号和源代码的搜索路径.
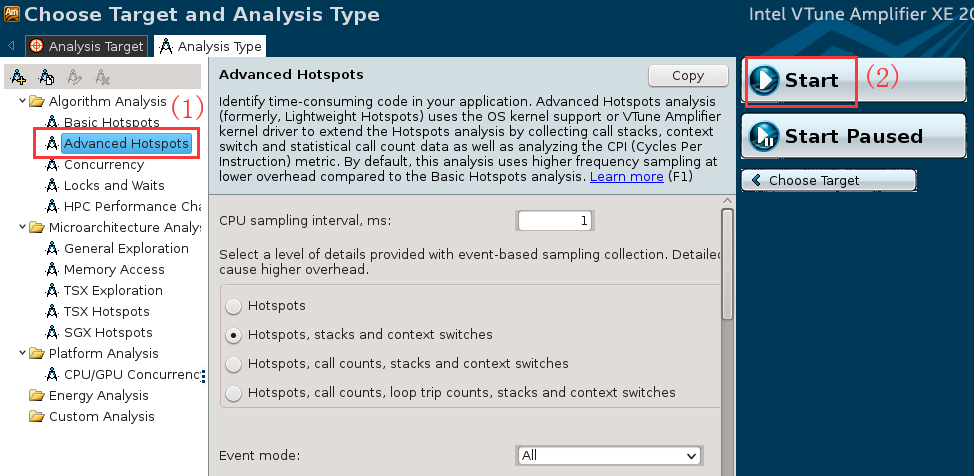
接着切换到”Analysis Type”视图, 选择分析类型为”Advanced Hotspots”, 设置完成后点击右侧的”Start”按钮开始分析.
分析代码
总览:
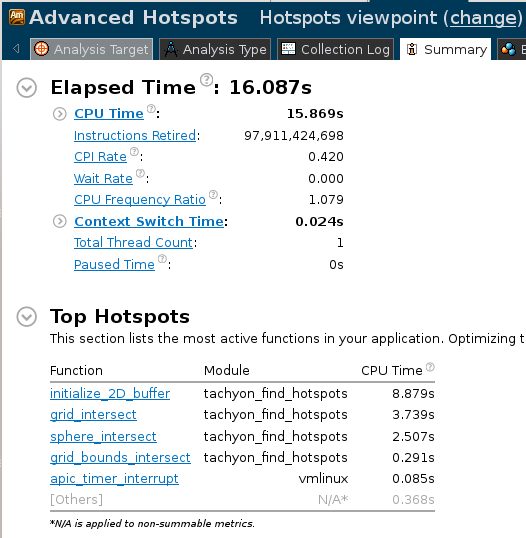
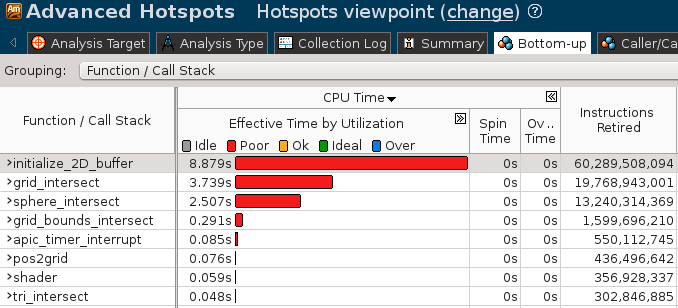
可以看到总的CPU时间以及最耗时的函数等信息. 切换到”Bottom-Up”视图, 可以看到热点函数的分析:
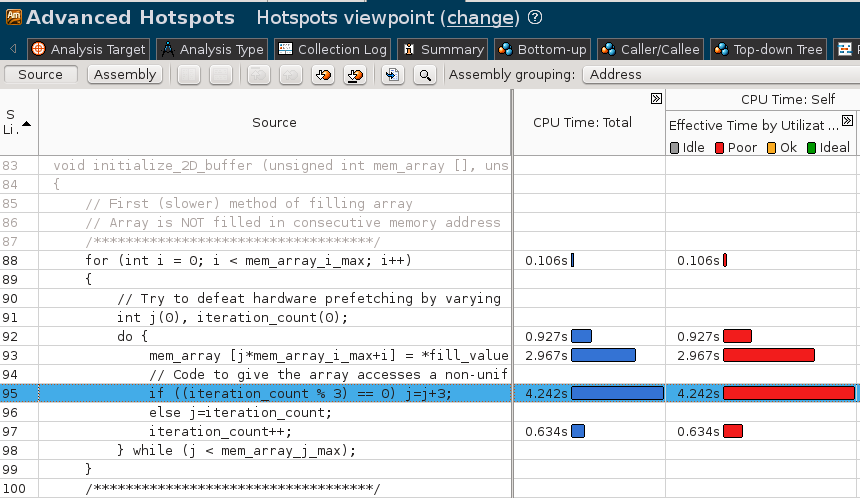
双击函数行, 可打开源代码窗口, 其中各出了对应代码行的性能分析. 分析代码可以知道这里的初始化代码访问不连续的内存来初始化数组, 导致prefetch失效, 影响了性能:
优化代码
根据源码中的提示, 注释掉旧代码, 而将下方被注释掉的代码取消注释, 重新编译程序.
新代码执行时间:
$ ./tachyon_find_hotspots dat/balls.dat
Scene contains 7386 bounded objects.

CPU Time: 7.011 seconds.
可见比之前节省了6秒. 重新运行vtune进行分析, 结果如下:
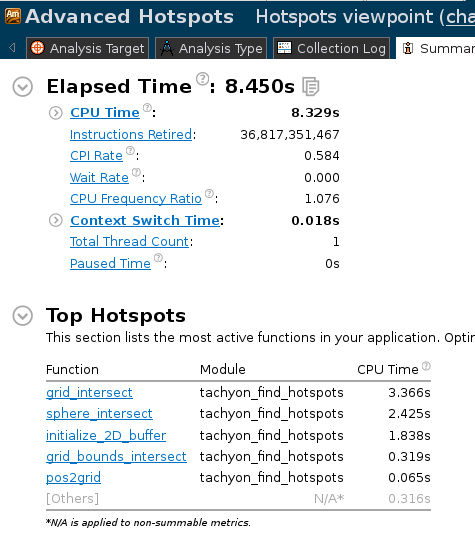
可见优化后CPU时间大幅下降, 耗时函数initialize_2D_buffer()被优化.
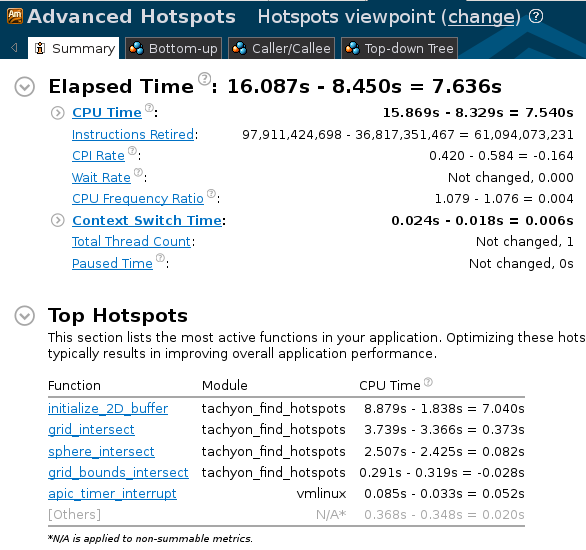
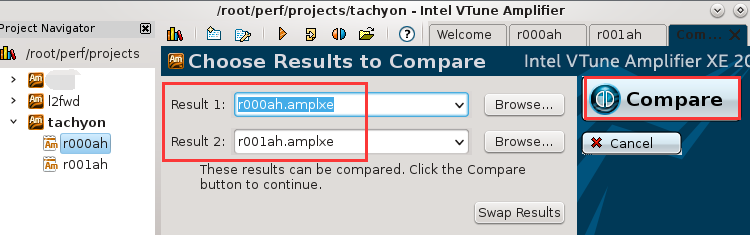
vtune提供了分析结果对比功能, 在分析结果上点右键, 选择”Compare”, 会出现结果对比窗口, 如下图所示. 选择要对比的分析结果, 然后点击右侧”Compare”即可进行对比:
注解
进行比较前请确保要对比的2个结果分析结果没有打开任何相关窗口
优化之前和优化之后的分析结果对比如下: