教程: 优化硬件利用率
本文更新于 2018.10.10
本文演示了如何分析硬件相关的性能问题, 如数据共享, cache miss, 分支预测失败等.
参考: https://software.intel.com/en-us/vtune-hw-issues-tutorial-lin-pdf
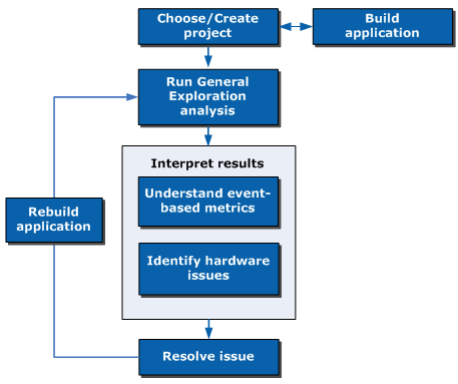
工作流:
编译示例程序
本教程使用matrix示例, 位置在 /opt/intel/system_studio_2019/samples_2019/en/vtune_amplifier/C++/matrix_vtune_amp_xe.tgz, 将其解压至某目录, 进入matrix/linux目录运行make进行编译.
如果用intel编译器, 请先设置环境变量:
source /opt/intel/system_studio_2019/compilers_and_libraries_2019.0.120/linux/bin/compilervars.sh -arch intel64
然后运行make icc:
$ make icc
icc -g -O3 -DUSE_THR -DICC -debug inline-debug-info  -c ../src/util.c -D_LINUX
icc -g -O3 -DUSE_THR -DICC -debug inline-debug-info  -c ../src/thrmodel.c -D_LINUX
icc -g -O3 -DUSE_THR -DICC -debug inline-debug-info  -xSSE3  -c ../src/multiply.c -D_LINUX
icc -g -O3 -DUSE_THR -DICC -debug inline-debug-info  -xSSE3  -c ../src/matrix.c -D_LINUX
icc -g -O3 -DUSE_THR -DICC -debug inline-debug-info  util.o thrmodel.o multiply.o matrix.o  -o matrix.icc -lpthread -lm
更多帮助见matrix/readme.txt. 编译完成后运行程序, 可以看到执行时间:
$ ./matrix.icc
Addr of buf1 = 0x7fe9ed2b7010
Offs of buf1 = 0x7fe9ed2b7180
Addr of buf2 = 0x7fe9eb2b6010
Offs of buf2 = 0x7fe9eb2b61c0
Addr of buf3 = 0x7fe9e92b5010
Offs of buf3 = 0x7fe9e92b5100
Addr of buf4 = 0x7fe9e72b4010
Offs of buf4 = 0x7fe9e72b4140
Threads #: 16 Pthreads
Matrix size: 2048
Using multiply kernel: multiply1
Freq = 3.199968 GHz
Execution time = 16.780 seconds
创建vtune工程并运行分析
创建vtune工程, 分析类型为Microarchitecture Exploration, 并配置可执行程序路径和源代码搜索路径等:
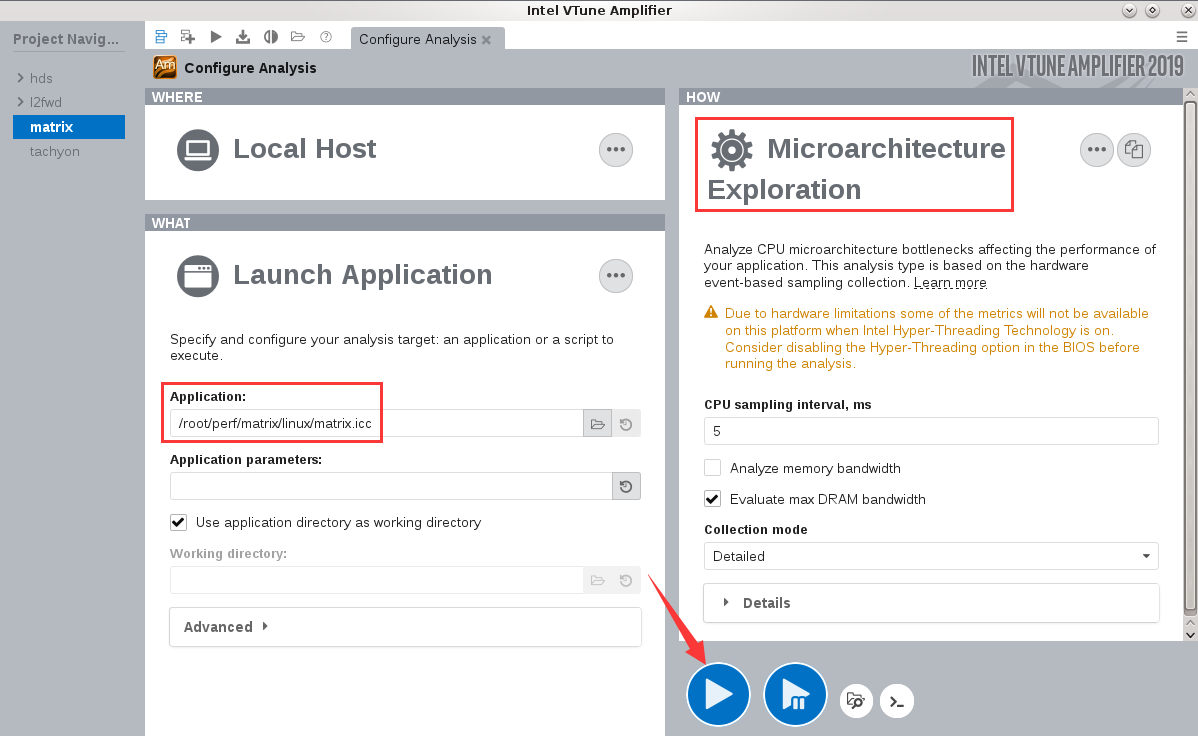
完成后点击开始按钮开始分析.
注解
进行分析前最好通过BIOS设置关闭超线程支持, 否则对性能数据收集有影响. 性能分析工作完成后记得改回来
分析代码
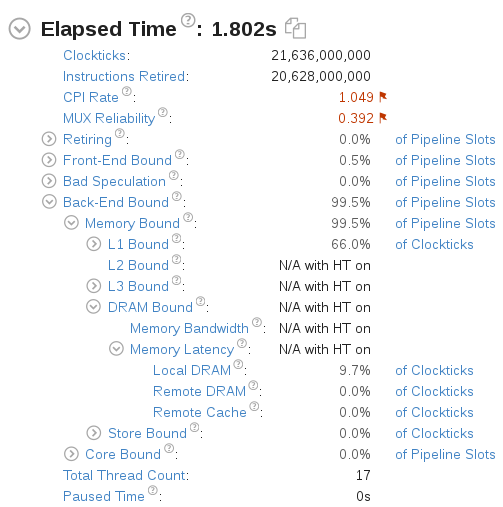
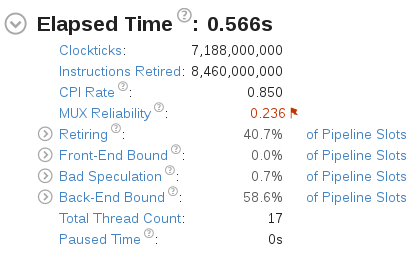
分析完成后概览信息如下:
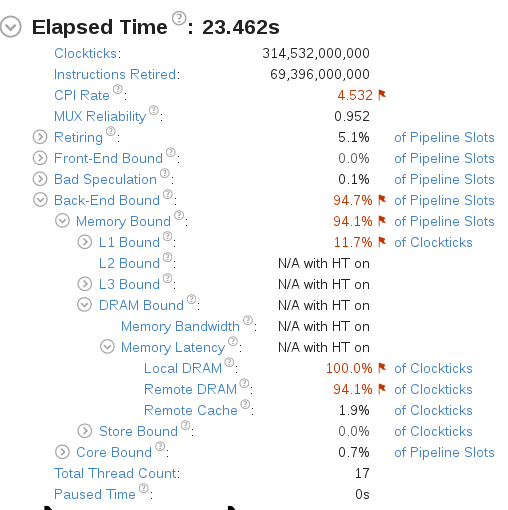
其中可见CPI(Cycles per Instructions Retired) Rate和内存访问有性能问题.
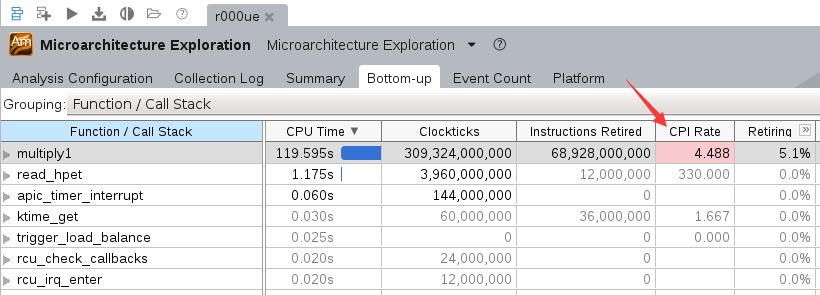
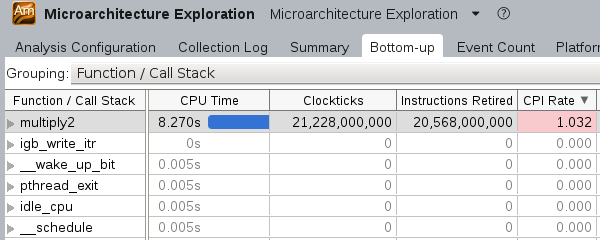
切换到”Bottom-Up”视图, 可以看到multiply1函数占用了大量CPU时间, 需要优化:
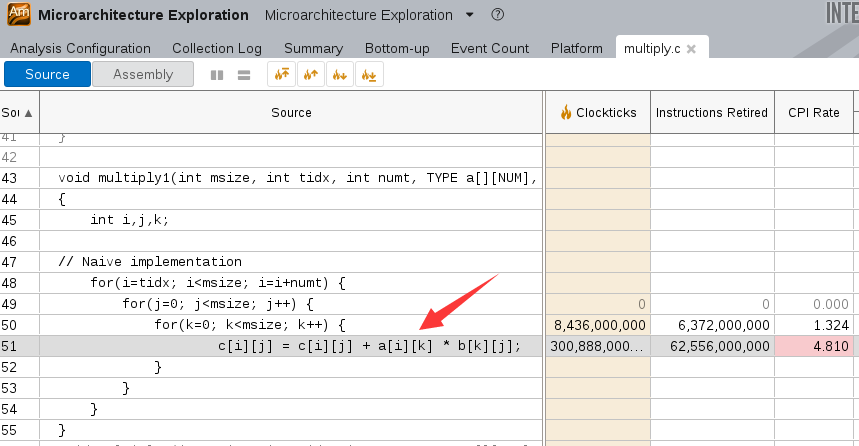
双击函数行打开源代码窗口, 可以看到第51行的代码, 它在进行矩阵运算时对内存的访问比较低效.
优化代码
编辑multiply.h, 将MULTIPLY宏定义替换为multiply2, 表示使用multiply2函数, 此函数使用了”loop interchange”机制来优化内存访问.
// Step 2: Loop interchange
// Add compile option for vectorization report Windows: /Qvec-report3 Linux -vec-report3
for(i=tidx; i<msize; i=i+numt) {
    for(k=0; k<msize; k++) {
#pragma ivdep
        for(j=0; j<msize; j++) {
            c[i][j] = c[i][j] + a[i][k] * b[k][j];
        }
    }
}
其中, #pragma ivdep告诉intel编译器忽略假定的矢量依赖(Ignore assumed Vector DEPendencies), 它将令编译器启用SSSE.
保存修改后重新编译matrix, 运行:
$ ./matrix.icc
Addr of buf1 = 0x7f9650a20010
Offs of buf1 = 0x7f9650a20180
Addr of buf2 = 0x7f964ea1f010
Offs of buf2 = 0x7f964ea1f1c0
Addr of buf3 = 0x7f964ca1e010
Offs of buf3 = 0x7f964ca1e100
Addr of buf4 = 0x7f964aa1d010
Offs of buf4 = 0x7f964aa1d140
Threads #: 16 Pthreads
Matrix size: 2048
Using multiply kernel: multiply2
Freq = 3.149062 GHz
Execution time = 1.972 seconds
可见执行时间从16.780秒缩短到1.972秒, 提升了8倍还多.
进一步分析和优化
对修改后的代码再进行一次Microarchitecture Exploration分析, 概要信息如下:
打开”Bottom-up”示图, 可以看到multiply2函数仍有优化空间:
打开源代码视图, 并打开反汇编, 可以看到#pragam ivdep下面的代码已经被编译为矢量化指令:
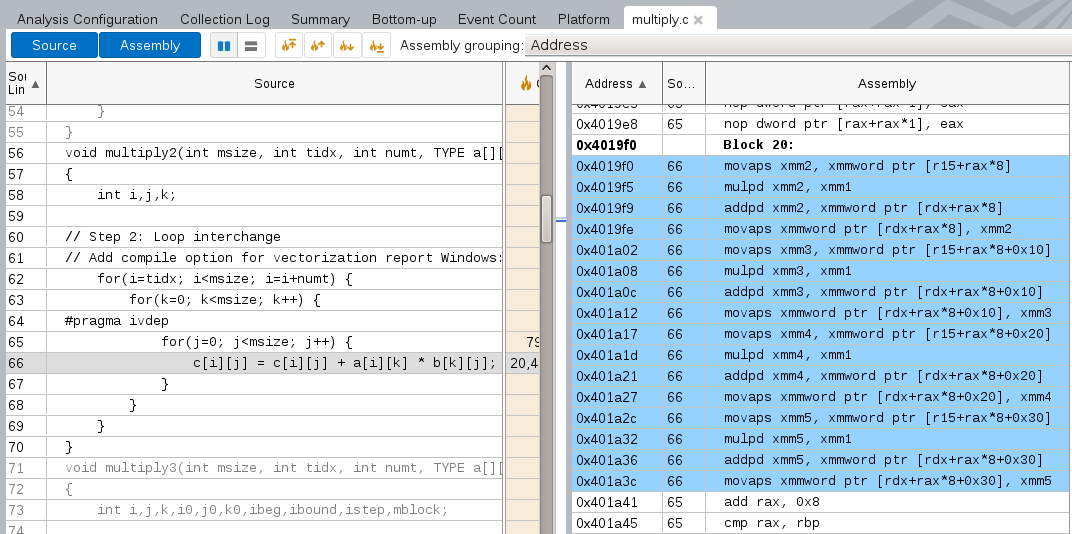
所有矢量化指令以p为后缀(如, mulp dx), 可以使用-vec-report3编码选项来让intel编译器生成编译器优化报告, 以发现哪些cycle未被矢量化及其原因.
再次修改代码, 将运算函数改为multiply3:
// Step3: Cache blocking
// Add current platform optimization for Windows: /QxHost Linux: -xHost
// Define the ALIGNED in the preprocessor definitions and compile option Windows: /Oa Linux: -fno-alias
istep = msize / numt;
ibeg = tidx * istep;
ibound = ibeg + istep;
mblock = MATRIX_BLOCK_SIZE;

for (i0 = ibeg; i0 < ibound; i0 +=mblock) {
    for (k0 = 0; k0 < msize; k0 += mblock) {
        for (j0 =0; j0 < msize; j0 += mblock) {
            for (i = i0; i < i0 + mblock; i++) {
                for (k = k0; k < k0 + mblock; k++) {
#pragma ivdep
#ifdef ALIGNED
    #pragma vector aligned
#endif //ALIGNED
                    for (j = j0; j < j0 + mblock; j++) {
                        c[i][j]  = c[i][j] + a[i][k] * b[k][j];
                    }
                }
            }
        }
    }
}
修改Makefile:
OPTFLAGS = -xHost -fno-alias -DALIGNED
重新编译运行:
$ ./matrix.icc
Threads #: 16 Pthreads
Matrix size: 2048
Using multiply kernel: multiply3
Freq = 2.399906 GHz
Execution time = 0.534 seconds
执行时间进一步缩短. 重新运行Microarchitecture Exploration分析, 概要信息如下:
CPI Rate和内存利用率数据进一步提升.